Experimental · automated analysis · v01 · 2026-10-11
Deaths mentioning osmotic demyelination syndrome in the US, 1999-2024
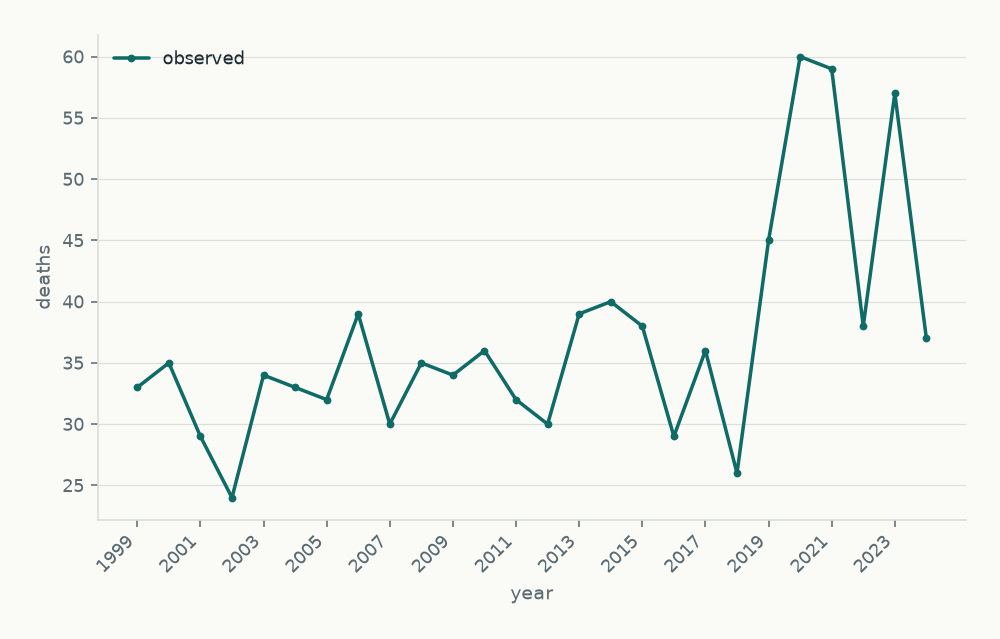
This brief describes annual US deaths with osmotic demyelination syndrome (ICD-10 G37.2) mentioned anywhere on the death certificate from 1999 to 2024, using CDC WONDER national data. Deaths numbered 33 in 1999 and 37 in 2024, with a low of 24 in 2002 and a peak of 60 in 2020. The crude rate was about 0.012 per 100,000 in 1999 and about 0.011 in 2024, so the endpoint rates did not rise. A log-linear Poisson model with quasi-Poisson variance gave a rate ratio of 1.011 per year (1.001 to 1.022; p = 0.033), about 1.1% a year, which is only marginally above no change. The estimate is fragile. It is driven by a cluster of elevated years from 2019 onward, and it crosses 1 when the series ends in 2022 or earlier. The 1999-2018 window, which excludes the late years, gave a rate ratio of 0.995 (0.982 to 1.008). A single long-run slope therefore describes this series poorly. It is better read as roughly level for two decades, followed by a few elevated late years that overlap the pandemic and a change of database and denominator. These data cannot link the pattern to any treatment practice.
Results
Counts and rates. Deaths with G37.2 mentioned numbered 33 in 1999 (crude rate about 0.012 per 100,000) and 37 in 2024 (about 0.011 per 100,000). Counts therefore rose by 4 deaths, about 12%, while the crude rate was slightly lower, because the population grew. Over the full period the mean was 36.9 deaths a year and the median was 35, with 960 deaths in total. The lowest count was 24 in 2002 (about 0.008 per 100,000) and the highest was 60 in 2020 (about 0.018 per 100,000). Series shape. Counts stayed roughly between 24 and 40 a year from 1999 through 2018, with 26 in 2018. They then rose to 45 in 2019 and 60 in 2020, stayed high at 59 in 2021, fell back to 38 in 2022, rose to 57 in 2023 and returned to 37 in 2024. Primary trend. The log-linear model gave a rate ratio of 1.011 per year (95% interval 1.001 to 1.022; p = 0.033), about a 1.1% increase in the crude rate per year. The dispersion was 1.47, so counts were more variable than a plain Poisson model assumes. The interval only just excludes no change, and the direction is a slight rise, not the decline hypothesised. This slope sits beside endpoint rates that are slightly lower in 2024 than in 1999, so one number does not summarise the series. Fragility. Removing one year at a time gave rate ratios from 1.008 (when 2020 was left out) to 1.014 (when 2024 was left out), and 21 of 26 refits had intervals excluding no change, so five did not. Ending the series earlier changed the result. Ending in 2023 gave 1.014 (1.003 to 1.025; p = 0.014), and ending in 2021 gave 1.012 (1.000 to 1.025; p = 0.047). Ending in 2022 gave 1.011 (0.999 to 1.022; p = 0.069), ending in 2020 gave 1.007 (0.995 to 1.020; p = 0.25), ending in 2019 gave 0.999 (0.987 to 1.011; p = 0.90), and ending in 2018 gave 0.995 (0.982 to 1.008; p = 0.46). The last three are inconclusive: the 1999-2018 data are compatible with a decline of about 2% a year or a rise of under 1% a year. The apparent upward slope depends on the final few years. Not assessed. Level or slope changes around the 2007, 2013 and 2014 guideline dates, and the sensitivity fit excluding 2020-2021, are not in the results, so those questions are unanswered here. Residual autocorrelation in the annual series was not checked.
Background
Osmotic demyelination syndrome, including central pontine myelinolysis, is a rare neurological disorder, generally associated with rapid correction of low blood sodium and with conditions such as alcohol use disorder, malnutrition and liver disease. Because it is rare and often recognised only on imaging, death-certificate counts are small, and recorded mentions can shift with imaging availability, diagnostic attention and certification practice. Clinical guidance on sodium correction was published in 2007, 2013 and 2014, and a question of interest is whether mortality involving the condition moved over time. Death-certificate data cannot show treatment practice, so any such pattern here is descriptive only. No prior literature relevant to this question was supplied, so the context is described in general terms.
Methods
Design: national annual trend analysis of death-certificate data, all ages and both sexes combined. Source: CDC WONDER multiple-cause-of-death files, using the D77 database for 1999-2020 and the D157 database for 2021-2024. Overlap years 2018-2020 were checked and matched. Case definition: any mention of G37.2 on the certificate, whether as underlying or contributing cause. Window: calendar years 1999 to 2024, 26 annual rows, all retained; no rows were suppressed or dropped. Only final data were used; provisional data were not included. Crude rates per 100,000 population were reported, with no age adjustment. Method: a Poisson rate model of annual counts with log(population) as offset and a single log-linear time trend with no breakpoint, giving a rate ratio per year. Uncertainty came from quasi-Poisson variance scaled by the Pearson dispersion. Robustness checks were leave-one-year-out refits and refits with the newest years removed in turn (ending 2023, 2022, 2021, 2020, 2019 and 2018). The refit ending in 2018 is equivalent to the planned 1999-2018 window. Planned dropping of 2020-2021 and the exploratory breakpoint models at 2007, 2013 and 2014 are not in the results and were not carried out. Multi-year averages for 1999-2003 versus 2020-2024 were also planned but are not in the results.
Limitations
- The data are ecological, population-level death-certificate counts. They cannot establish causes of any change or any link to treatment practice or guideline publication.
- Any-mention counts depend on certification and coding practice, which may change over time, and they may not reflect true incidence. Increasing MRI use and changes in multiple-cause coding may alter recorded diagnosis independent of true risk.
- Only fatal certified cases are captured. Non-fatal cases and survivors are not, so the series reflects mortality, not incidence. Underlying-cause-only counts are not in this dataset, so the data cannot separate underlying from contributing cause.
- The 2019-2023 period overlaps the COVID-19 pandemic. The late elevation may reflect pandemic-era mortality or certification patterns rather than a real long-run change, and this cannot be separated with these data.
- Counts are small, so year-to-year noise is large and trend estimates are imprecise. Overdispersion means unadjusted Poisson intervals would overstate precision, and the slope is sensitive to a few late years.
- The fitted slope is fragile. Its lower interval bound is just above 1, the p-value is about 0.03, the estimate crosses 1 when the series ends in 2022 or earlier, and only some leave-one-out refits exclude no change. The endpoint rates point the opposite way to the slope.
- A single log-linear trend imposed on a series that is flat and then shows a short late cluster does not represent the long-run trend well, and one number cannot describe it.
- The planned sensitivity fits were not completed: dropping 2020-2021 and the breakpoint models at 2007, 2013 and 2014 are absent. The hypothesis about level or slope change around guideline dates is therefore not addressed, and any such analysis would be exploratory and unable to support causal inference.
- The late elevation coincides with the switch from the D77 to the D157 database and with Modified Blended Base population denominators from 2021. Neither can be separated from a real change. Overlap years 2018-2020 matched, but residual differences cannot be excluded. Residual autocorrelation was not checked.
- Crude rates are not age-adjusted. An ageing population can raise a crude rate without any change in age-specific risk, and changes in the prevalence of alcohol use disorder, liver disease, malnutrition, hyponatremia and diuretic use are not adjusted for.
- Population denominators change in method across years (intercensal, Census counts, bridged-race and single-race postcensal estimates, and Modified Blended Base for 2021 onward), which may introduce small discontinuities in rates.
- Source notes flag data-quality caveats for specific states and years (excess R99 coding in Georgia 2008-2009, New Jersey 2009 and California 2000-2001, and a revision of 125 deaths in 2014) that could slightly affect cause coding.
- Only final data were used and provisional data were not included. WONDER suppression and unreliability flags are not in this dataset and were not analysed; stratification by age, sex, race or region and age-adjusted rates are out of scope because of small counts.
What the analysis excluded
- Restricted to series='Osmotic demyelination syndrome (G37.2), any mention on certificate' (Single series: G37.2 as any mention (multiple cause) on the certificate); 26 of 26 rows.
- Restricted to the window 1999-2024 on 'year' as the question asks; 26 of 26 rows retained.
- Rates modelled as counts against 'population' as a population offset, so the trend is reported as a rate ratio per period.
Conclusion
Deaths with osmotic demyelination syndrome mentioned on the certificate were similar in 1999 and 2024 (33 and 37), and the crude rate was slightly lower at the end (about 0.012 and 0.011 per 100,000). The series was roughly level through 2018 and elevated in several years from 2019 onward. The fitted trend of about 1.1% a year, with an interval only just above no change, is associated with those late years and is not robust to ending the series earlier. The data are compatible with a stable long-run rate with a late, unexplained elevation that overlaps the pandemic and changes in database and denominator. They do not support statements about guideline effects or treatment practice.
Comments and corrections
This is an experimental analysis and we want to hear where it falls short: a number that looks wrong, a limitation we missed, a better data source, or wording that overstates what the data show. Comments are read by a person and can lead to a revised version; earlier versions stay online.
Email a comment or write to [email protected] and mention
osmotic-demyelination-mortality-trendv01.