Experimental · automated analysis · v02 · 2026-09-30
Ohio and US Age-Adjusted Overdose Death Rates, 1999-2018
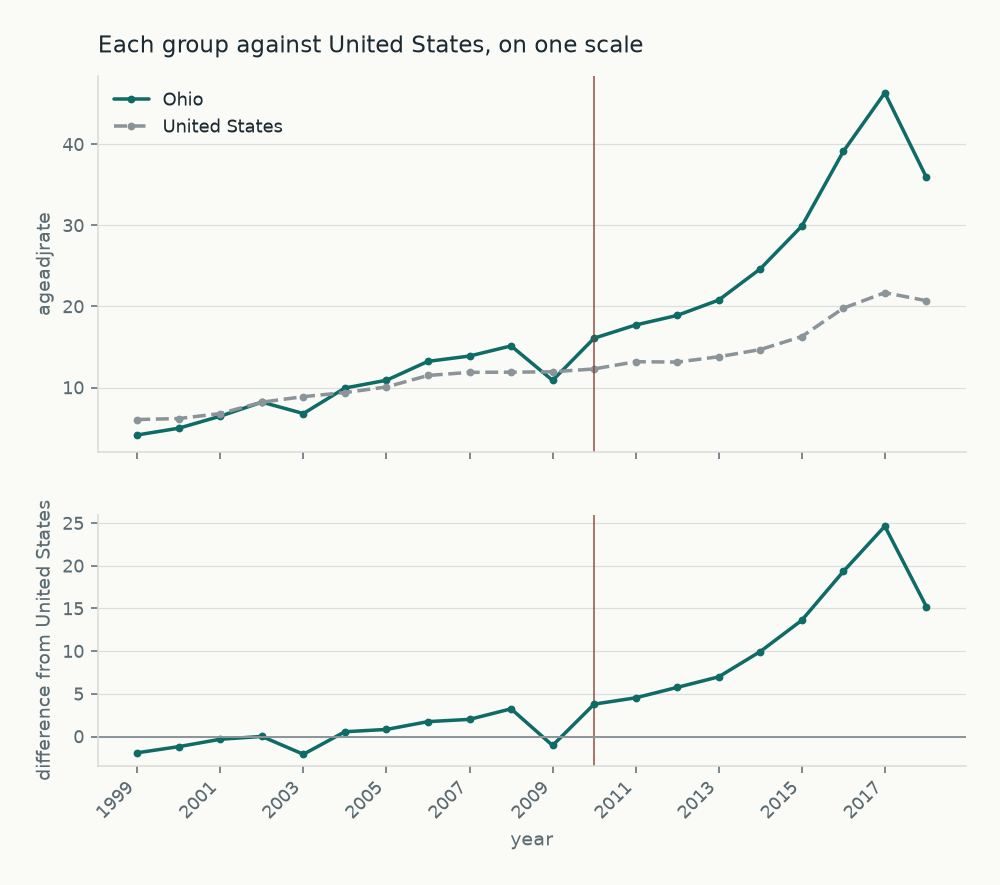
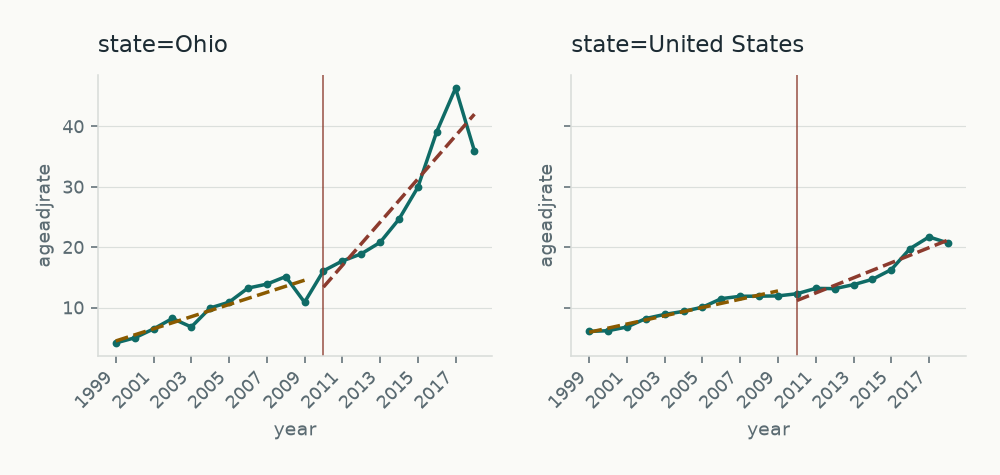
This brief describes annual age-adjusted drug poisoning death rates per 100,000 residents in Ohio and the United States from 1999 to 2018. Ohio's rate rose from 4.15 in 1999 to 35.93 in 2018, with a peak of 46.35 in 2017. The US rate rose from 6.06 to 20.71, with a peak of 21.70 in 2017. Ohio started below the national rate (ratio 0.69 in 1999), fluctuated around it through 2009, and stayed above it from 2010 through 2018. The gap was widest in 2017, at 24.64 deaths per 100,000, or 2.14 times the national rate. It narrowed to 15.22 (ratio 1.73) in 2018. A segmented linear fit with a pre-specified 2010 breakpoint gave an Ohio slope of 1.01 per year before 2010 and 3.58 per year after. The US slope went from 0.68 to 1.25. These findings are associations from ecological, state-level data. The annual rates carry no confidence intervals, the 2017-2018 values may be provisional, and the 2018 decline should not be read as a turning point.
Results
Ohio series. The Ohio rate was 4.15 per 100,000 in 1999 (its minimum) and 35.93 in 2018, a rise of about 766%. It peaked at 46.35 in 2017. The US rate was 6.06 in 1999 (its minimum) and 20.71 in 2018, a rise of about 242%. It also peaked in 2017, at 21.70. Over the period the mean Ohio rate was 17.70 and the mean US rate was 12.42. Ohio compared with the US. In 1999 Ohio was 1.91 below the national rate (4.15 vs 6.06; ratio 0.69). The early comparison fluctuated. Ohio was still below the US in 2001 (ratio 0.95) and was essentially level in 2002 (ratio 1.00). It fell below again in 2003 (ratio 0.77), moved above from 2004, and dipped below once more in 2009 (ratio 0.91). Ohio has been above the national rate in every year since 2010 (16.09 vs 12.30; ratio 1.31 in 2010). Because the sign changed several times before 2010, no single crossover year is named. The gap widened steadily after that: 6.99 in 2013 (ratio 1.51), 13.62 in 2015 (ratio 1.84) and 19.34 in 2016 (ratio 1.98). It was widest in 2017, with Ohio at 46.35 against 21.70 nationally, a difference of 24.64 and a ratio of 2.14. In 2018 the difference was 15.22 and the ratio was 1.73. Across the whole period the gap grew by about 1.11 per 100,000 per year (p < 0.001, descriptive only). The full per-year table is on the results page. Slope change. Ohio's slope was 1.01 per year before the 2010 breakpoint and 3.58 per year after, a change of 2.57 (robust p < 0.001). The US slope went from 0.68 to 1.25, a change of 0.57 (robust p < 0.001). Ohio's slope change exceeded the US change by 2.01 per year (robust p < 0.001). The estimated level change at 2010 was -2.15 for Ohio (p = 0.48) and -2.27 for the US (p = 0.014). The fits explained a high share of variation (R-squared 0.93 for Ohio and 0.97 for the US). The Durbin-Watson statistics were 1.92 for Ohio and 1.40 for the US. Sensitivity. Moving the breakpoint changed the size of the Ohio slope change but not its direction. It was 1.90 at 2008, 2.27 at 2009, 2.84 at 2011 and 3.11 at 2012, all with robust p < 0.001. The US slope change was 0.25 at 2008 (robust p = 0.086), 0.40 at 2009, 0.73 at 2011 and 0.94 at 2012.
Background
Drug poisoning (overdose) deaths have been a major and changing contributor to mortality among US adults, and national analyses of poisoning-related deaths have documented long-run increases from 1999 onward [PMID 42065199]. State-level mortality among working-age adults differs across states, and published reports have linked those differences to state policy and political contexts [PMID 36288322] [PMID 37232531]. Ohio is often discussed as a state with a heavy overdose burden. This brief asks how Ohio's age-adjusted overdose death rate changed over 1999-2018 and how it compared with the national rate in each year. It also asks whether the Ohio-US gap widened. It describes patterns only and does not address why they occurred.
Methods
Source: CDC's data.cdc.gov, dataset 44rk-q6r2 (NCHS drug poisoning mortality), vintage 2020-09-08. This dataset was pinned by the caller and substituted for the suggested NCHS state-trends source. The input had 40 rows: 20 annual rows each for Ohio and the United States. No rows were suppressed and none were dropped. Time window: 1999 to 2018, annual, with each row treated as a discrete yearly value rather than a rolling window. Filters: sex Both Sexes, age All Ages, and race All Races-All Origins, which left one series per group with all 40 rows retained. The outcome is the age-adjusted death rate per 100,000 residents, standardised to the 2000 US population. The United States was the reference group. For each year the analysis reports the Ohio rate, the US rate, the absolute difference (Ohio minus US) and the rate ratio (Ohio divided by US), plus the years in which the sign of the difference changed. Each series was fitted with a segmented linear regression with a single breakpoint at 2010. The breakpoint was fixed in advance from the hypothesis and not chosen from the data. The fit gives slopes before and after the break, the change in slope and the change in level. Ordinary p-values are reported alongside Newey-West (autocorrelation-robust) p-values, and the robust ones are preferred. Sensitivity refits used breakpoints at 2008, 2009, 2011 and 2012. A linear trend on the annual difference and a test of whether Ohio's slope change differed from the US slope change were also run. All p-values are descriptive only.
Limitations
- The data are ecological, state-level aggregates and cannot support individual-level or causal inference.
- Only Ohio and United States rows are present. The US series includes Ohio, so the reference is not independent, the gap is slightly understated, and p-values on the difference trend are not valid formal tests.
- The annual rates have no confidence intervals or standard errors, so year-level noise, especially in the early years when Ohio crossed above and below the national rate, cannot be quantified.
- There are only 20 annual points and they are serially correlated. Ordinary least squares p-values overstate precision, so all p-values are descriptive. Newey-West errors were used where available.
- A segmented linear fit imposes a piecewise-linear shape. The series accelerates after about 2013 and dips in 2018, so slope estimates depend on the assumed breakpoint and are exploratory.
- The 2017-2018 values may be provisional, smoothed or revised. The 2018 decline should not be read as a turning point. The planned refits with and without 2018 and with breakpoints at 2013 and 2014 were not among the results provided, so they are not reported here.
- No breakdown by drug type (opioid, fentanyl, heroin or other) was obtained, so drivers of the change in slope cannot be attributed.
- The dataset was substituted for the suggested source, so its vintage (2020-09-08) and any smoothing should be checked against CDC WONDER final values.
- The analysis restricted the data to both sexes, all ages and all races and origins, and it says nothing about differences within those groups.
What the analysis excluded
- Restricted to sex='Both Sexes' (single sex category; keeps one series per state); 40 of 40 rows.
- Restricted to age='All Ages' (single age category; rate is already age-adjusted); 40 of 40 rows.
- Restricted to race='All Races-All Origins' (single race/origin category); 40 of 40 rows.
- Restricted to the window 1999-2018 on 'year' as the question asks; 40 of 40 rows retained.
Conclusion
Ohio's age-adjusted overdose death rate rose from 4.15 to 35.93 per 100,000 between 1999 and 2018, peaking at 46.35 in 2017. The national rate rose more slowly, from 6.06 to 20.71. Ohio fluctuated around the national rate through 2009 and stayed above it from 2010 onward. The gap in both absolute terms and ratio was widest in 2017 and remained large in 2018. The rise in Ohio's rate steepened after 2010 by more than the national rate did, though the exact size of the change depends on the breakpoint chosen. These are associations in aggregate data with provisional recent values, and they do not identify the reasons for the changes.
Comments and corrections
This is an experimental analysis and we want to hear where it falls short: a number that looks wrong, a limitation we missed, a better data source, or wording that overstates what the data show. Comments are read by a person and can lead to a revised version; earlier versions stay online.
Email a comment or write to [email protected] and mention
ohio-vs-us-drug-poisoning-death-trendv02.