Automated analysis · v01 · 2026-08-12
Ohio Opioid Overdose Trend Since 2015 Using Rolling CDC Provisional Data
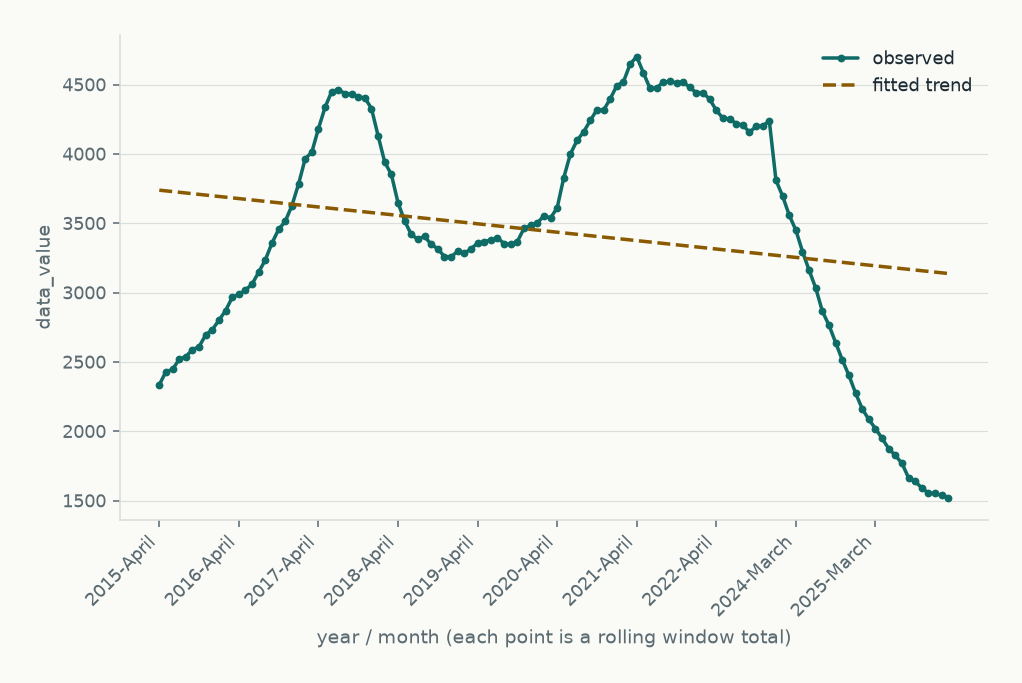
This analysis examined whether opioid overdose deaths in Ohio have declined since 2015 using CDC's Provisional Drug Overdose Death Counts, a rolling 12-month series that extends the requested 2020-2023 window because that was the data available. Because the dataset used has no county field and reports raw counts rather than age-adjusted rates, the county-by-county comparison asked for in the question could not be produced, and the trend below describes counts, not rates. The fitted linear trend across the ordered rolling series pointed downward and was statistically significant, though it explained only a small share of the month-to-month variation, and the raw count fell from the start to the end of the series. This is an automated, ecological analysis of aggregate counts and cannot establish what drove the change.
Results
After filtering and exclusions, 120 rows remained, covering the rolling 12-month period ending April 2015 through the rolling 12-month period ending February 2026. The rolling death count began at 2335.0 in the first period and ended at 1522.0 in the last period, an absolute change of -813.0 over the full series; across the series the value ranged from a minimum of 1522.0 to a maximum of 4702.0. A linear trend fitted to this ordered series was decreasing and statistically significant, though the model explained only a small share of the overall variation in the series, consistent with a rolling measure that fluctuates over many overlapping windows even as its longer-run trajectory moves downward. No county-level breakdown could be generated because the underlying dataset does not contain a county field, and because the values are raw death counts rather than age-adjusted rates, this result speaks to the trend in counts over time rather than to age-adjusted rate change.
Background
Opioid overdose mortality has been a persistent and evolving public health concern in Ohio, with prior work documenting shifts toward synthetic opioids, geographic variation in impact, and community-level social determinants tied to fatal overdose risk [PMID 40657589] [PMID 37866438] [PMID 36846577]. Statistical modeling of Ohio-specific overdose patterns has previously identified spatiotemporal change points in the state's opioid mortality trajectory [PMID 34721750], and national analyses have described a broader 'fourth wave' of overdose deaths tied to shifting drug supply and diminished prescription access [PMID 35322965]. Other work has cautioned that provisional overdose counts can understate the true decline or rise once data are finalized [PMID 34107224], and that opioid-related mortality intersects with other health complications such as gastrointestinal disease [PMID 40693060]. Community institutions, including public libraries, have also been documented as responding to the opioid crisis in Ohio [PMID 38760681]. Against this backdrop, the current question asked whether age-adjusted opioid overdose death rates in Ohio, overall and by county, have declined from 2020 through the most recent finalized year.
Methods
This analysis used CDC's VSRR Provisional Drug Overdose Death Counts dataset (data-cdc-gov, dataset ID xkb8-kh2a, vintage 2026-07-15), which is a rolling 12-month-ending series rather than discrete calendar-year totals. The data were filtered to the indicator 'Opioids (T40.0-T40.4,T40.6)' to restrict to the overall opioid overdose death category rather than pooling with cocaine, methadone, or other drug-specific indicators; this filter kept 134 of 1,608 input rows. Rows with reporting under 100% complete were excluded (11 rows dropped), and three additional rows with suppressed or missing values were excluded and were not imputed or treated as zero. This left 120 rows analyzed, spanning from April 2015 through February 2026. Because the series is a rolling 12-month total, values were analyzed as levels over time (never summed), and a single linear trend was fit to the ordered series (year and month as the time axis, the death count as the outcome) to test for directional change; no grouping variable (such as county) was available in this dataset, so no breakdown by county could be produced.
Limitations
- This dataset (CDC VSRR provisional counts) contains no county column, so a county-by-county breakdown as asked in the question could not be produced from this data \u2014 only a single statewide Ohio series is available
- The outcome here is a raw death count, not an age-adjusted rate; no population denominator is present, so age-adjustment and true rate comparisons over time are not possible with this data
- Rows are 12-month-ending rolling windows, so consecutive monthly points are highly autocorrelated and represent overlapping periods, not independent annual observations; a fitted slope describes a smoothed multi-year trend, not year-to-year change
- Recent periods are provisional (98-100% complete) and will be revised upward, which can distort the estimated trend at the most recent end of the series
- This is an ecological, aggregate time-series design; it cannot establish causal drivers (e.g., policy effects or fentanyl-specific mechanisms) behind any observed trend
- Percent-complete varies by row but no explicit incomplete/partial flag column exists to exclude on beyond this percentage field
- The requested 2020-2023 timeframe could not be isolated; the available rolling series extends well before and after that window, and results describe the entire available series rather than a 2020-onward comparison specifically
- 134 of 1,608 rows were retained after restricting to the overall opioid indicator, and additional rows were excluded for incomplete reporting or suppression, so the analyzed series reflects a reduced and filtered subset of the original data
What the analysis excluded
- Restricted to indicator='Opioids (T40.0-T40.4,T40.6)' (Restrict to the overall opioid overdose death category rather than pooling with cocaine, methadone, or other drug-specific indicators); 134 of 1608 rows.
- 3 row(s) had no usable value (suppressed or missing) and were excluded from the analysis. They were not imputed or treated as zero.
- 11 row(s) with reporting under 100% complete were excluded.
- Series is rolling: each value is a trailing-window total. Values are analysed as levels over time and are never summed.
Conclusion
In this automated analysis of CDC's rolling provisional opioid overdose death series for Ohio, the statewide count of opioid overdose deaths was associated with a downward trend from 2015 through the most recent available period, and the count in the most recent period was lower than in the earliest period, though the linear trend explained only a small part of the variation over time. Because the underlying data lack a county field and report raw counts rather than age-adjusted rates, this analysis cannot address whether age-adjusted rates have declined statewide or determine whether any decline is uniform or uneven across Ohio counties, and the finding should be read as an association in aggregate provisional counts rather than a confirmed, finalized, or causal trend.